In short
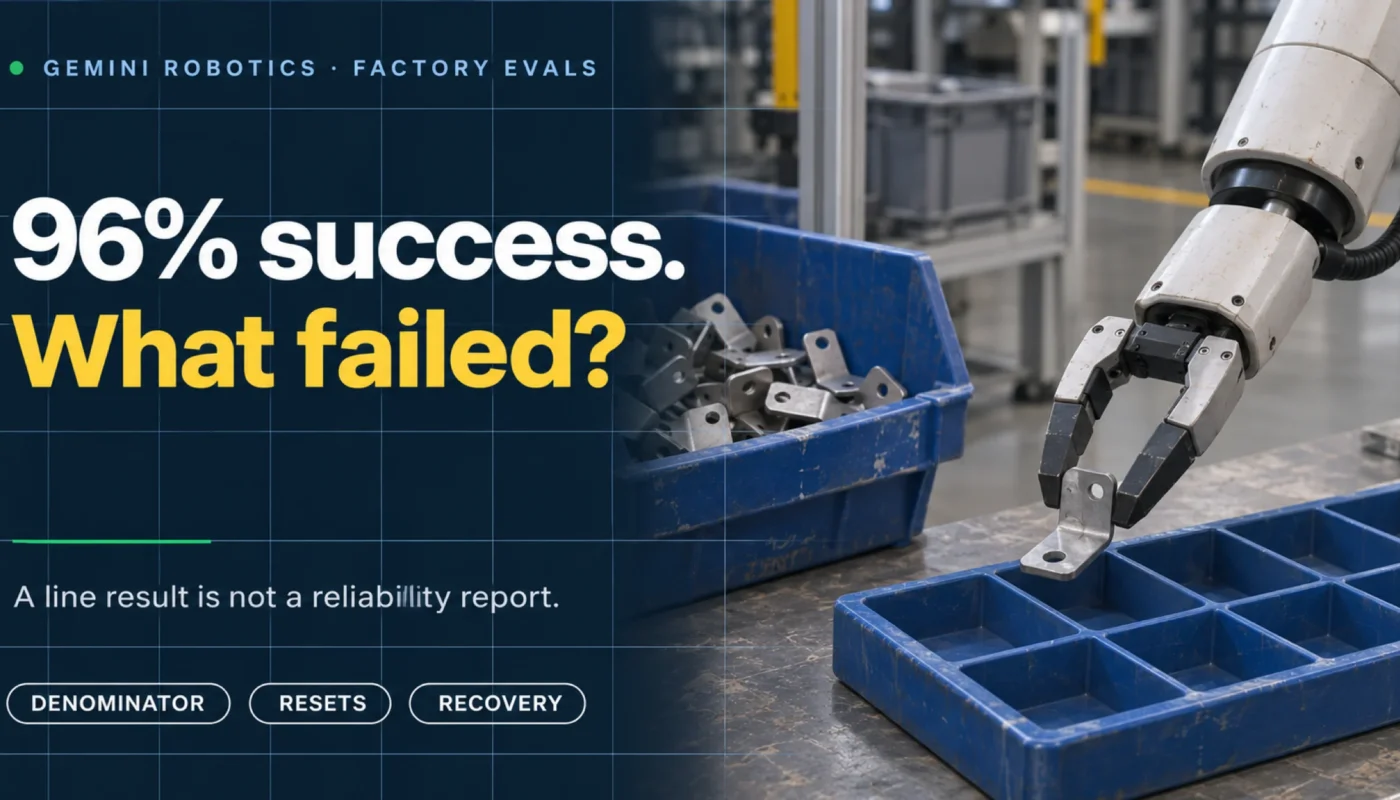
- The 96% result belongs to a specific proof of concept: Apollo 2 picked metal brackets from bulk bins and placed them into sequencing containers at Mercedes-Benz plants in Germany and Hungary.
- The announcement does not publish the denominator, trial duration, intervention count, reset policy or failure taxonomy. Without those fields, 96% cannot be converted into uptime, labour saved or a production SLA.
- A 4% attempt-failure rate compounds quickly. If attempts were independent, there would be about a 64% chance of at least one failure in 25 attempts and 98% in 100 attempts.
- The next useful artifact is not a larger headline number. It is an episode-level evaluation record: initial conditions, outcome, retries, human touches, recovery time and the exact denominator.
A metal bracket leaves a bulk bin, turns in a five-finger hand and settles into a blue sequencing container.
The motion is short. The consequence is not. On 10 November 2026, Google DeepMind introduced Gemini Robotics 2.5 and reported that, in a proof of concept on active Mercedes-Benz production lines, Apptronik’s Apollo 2 humanoid picked and packed automotive parts with a 96% success rate. The work ran in Kecskemét, Hungary, and Sindelfingen, Germany. [1]
That sentence contains almost everything a robotics announcement wants: a frontier model, a humanoid, a premium manufacturer, a real factory and a number close enough to 100 to feel inevitable.
It also leaves an operations team with the questions that begin after a demonstration succeeds. Ninety-six percent of what? Over how many attempts? Did a retry count as the same attempt or a new one? Who returned a dropped bracket to the bin? How long did recovery take? Were bent, oily or partially occluded parts in scope? What happened during the remaining four percent?
Those are not objections to the result. They are the fields required to use it.
The result is more interesting than the headline
DeepMind calls Gemini Robotics 2.5 its most capable vision-language-action model to date. A VLA receives observations and language and emits actions. In the Mercedes-Benz pilot, the stack was divided: Gemini Robotics ER tracked the multi-step workflow, while Gemini Robotics 2.5 controlled Apollo’s hands and arms. The robot reached into supply bins, picked metal brackets and placed them into sequencing containers, correcting for gaps as it worked. [1]
This division matters. The system is not one model producing an uninterrupted stream of magic. A high-level component tracks what should happen next; an action model produces physical motion; the robot’s controllers and safety layers execute it. Apptronik describes its broader platform similarly: Apollo 2 supplies the body, Artemis coordinates perception, planning, controls and task execution, and Fleet Connect handles operational monitoring and orchestration. [4]
The new model was also evaluated across more than 200 tasks. DeepMind reports 30% to 100% higher task success than previous baselines, depending on task type, and 20% to 30% faster completion. Examples include serving food with tongs, tying a bow, pipetting liquid, packing pastries and handling clothing. [1]
The charts identify Gemini Robotics 2 as the comparison for several task groups, and they show large improvements on some hard cases: closing a toolbox lid rises from 0% to 93%; untying a ribbon bow from 0% to 70%; hanging a cardigan from 0% to 62%. These are not cosmetic gains. Contact-rich tasks expose precisely the weaknesses that make general-purpose manipulation difficult.
The factory pilot adds another kind of evidence. The environment is active, the task is economically legible, and the robot transfers from post-training to production with what Apptronik’s CEO describes as “very little drop-off.” That is a stronger story than another isolated lab video.
But a transfer result and a deployment case are different milestones. The announcement supports the first. The data required for the second are not yet public.
Read “30% to 100% higher” as a relative gain
The broader model claim needs its own denominator. DeepMind says task success was 30% to 100% higher than previous baselines, depending on the task. That language describes a relative improvement, not an increase of 30 to 100 percentage points.
If a baseline succeeds 40% of the time, a 30% relative gain produces 52%, not 70%. A 100% relative gain doubles 40% to 80%; it does not create 140% success. The starting point determines how impressive the same multiplier looks.
The published charts make the range concrete. Packing pastries with tongs moves from 5% to 100%, while un-hanging a mug to a table moves from 29% to 75%. Closing a toolbox lid moves from 0% to 93%, where an ordinary relative percentage is undefined because the denominator is zero. The summary range is therefore useful as orientation, while the per-task bars carry the real information.
The 20% to 30% faster-completion claim has a similar dependency. Completion time can mean policy execution only, the interval from instruction to terminal state, or a cycle including verification and reset. A robot may move faster yet deliver fewer good units if errors take longer to recover. It may move only modestly faster yet transform a line if autonomous recovery removes technician calls.
For procurement, ask for the paired row: baseline success, new success, baseline cycle time, new cycle time, recovery time and the number of trials for each task family. Relative gains are most useful when the absolute values remain attached.
What does 96% actually divide?
A success rate is a fraction:
The difficulty hides inside “evaluation unit” and “eligible.” A unit could be a single grasp, one bracket placed in the correct cell, one completed tray, one vehicle kit or an uninterrupted time window. A failure could be a dropped part, a wrong cell, a timeout, a safety stop or a human intervention. Each definition can produce a defensible number. They do not describe the same system.
Suppose a robot must place ten brackets to complete one tray. If it makes 96 of 100 placements correctly, placement success is 96%. If those four failures occur in four different trays and any error invalidates a tray, only six of ten trays may be perfect. The underlying actions have not changed; the unit has.
That calculation assumes independent, identically distributed attempts. Real failures are rarely so polite. A reflective batch, a loose camera, a shifted bin or a worn fingertip can produce correlated errors. Correlation makes the average less informative because trouble arrives in clusters.
The public post gives the 96% headline and the task description. It does not state the number of trials, the scoring unit, confidence interval, time period, intervention rule, reset procedure or per-condition breakdown. It also does not publish the 96% pilot as an independent third-party measurement. Those are missing disclosures, not evidence that the result is wrong.
The denominator changes how confident 96% should feel
The same displayed percentage can represent very different amounts of evidence. Consider three hypothetical experiments that all round to exactly 96%:
| Successful units | Total units | Reported rate | Illustrative 95% Wilson interval |
|---|---|---|---|
| 24 | 25 | 96% | 80.5%–99.3% |
| 96 | 100 | 96% | 90.2%–98.4% |
| 2,400 | 2,500 | 96% | 95.2%–96.7% |
These rows are arithmetic illustrations, not reconstructions of the Mercedes-Benz pilot. Its denominator has not been disclosed in the cited announcement.
At 24 successes out of 25, the observed rate is impressive but uncertain. At 2,400 out of 2,500, the same point estimate is much more stable. Neither number alone proves transfer to another bracket, line, shift or plant. Statistical confidence and distribution coverage are separate questions.
A strong evaluation therefore publishes both:
deployment relevance = f(conditions represented, scoring rules, resets and failures)
Increasing the trial count narrows uncertainty around the tested setup. Expanding objects, lighting, bin fill, part orientation, operators, shifts and hardware age tests whether the setup was the right one.
Four percent becomes an operations problem
On an individual attempt, 96% sounds close to completion. Across repeated work, the four percent remainder becomes the schedule.
If attempts were independent with a constant 96% success probability, the chance of seeing at least one failure after n attempts would be:
| Attempts | Chance of at least one failure |
|---|---|
| 25 | 64.0% |
| 50 | 87.0% |
| 100 | 98.3% |
This does not mean the system is unsuitable. It means recovery design is part of the product. A dropped bracket that the robot detects, re-grasps and places eight seconds later is different from a wrong part that reaches downstream assembly. A pause cleared remotely in ten seconds is different from a safety stop that calls a technician across the floor.
Line rate should therefore be measured as good output after recovery, not motion speed before it:
As a simple illustration, let a placement attempt take ten seconds, success probability be 0.96 and each failed attempt require a 30-second reset. Ignoring recovery suggests 345.6 good placements per hour. Including it produces about 308.6. The model did not become less accurate; the operational denominator became honest.
Real deployments also need mean time between interventions, not only mean time between model errors. If the robot autonomously recovers from most errors, a 96% first-attempt rate can support a strong system. If every error needs a person, labour savings may collapse. The same model score can sit inside either business.
The world around the robot is part of the model
The original working title for this article was “The Robot Hit 96% on the Line. The Tray Was Already Sorted.” The primary source makes that wording too easy: Apollo was sorting individual parts from bulk bins into ordered trays. The input was not presented as a neatly pre-sorted sequence. [1]
The more useful point is subtler. Industrial environments are engineered, and that is a feature. Containers constrain where objects can appear. Sequencing trays define valid destinations. Fixtures reduce pose uncertainty. Lighting, guarding, part presentation and standard work all turn an unbounded physical problem into a repeatable one.
General-purpose intelligence and environmental engineering are complements. A capable VLA may handle more variation inside the cell. A good cell still removes variation that creates no customer value.
The enterprise question is not “Was the environment controlled?”
Every factory task has controls. The question is which controls the result depends on, how far they can drift, and whether those dependencies are affordable to reproduce across sites.
An evaluation envelope should describe at least:
- part families, sizes, finishes, damage states and permitted occlusion;
- bin geometry, fill level, clutter, part orientation and replenishment method;
- destination-tray geometry, tolerance and sequencing rules;
- camera position, lighting range, calibration age and contamination;
- robot hardware version, gripper wear, payload and control frequency;
- allowed retries, timeouts, safety stops, teleoperation and human resets;
- shift duration, thermal state and whether maintenance windows are excluded.
Without this envelope, “real world” is a location label. With it, another plant can decide whether the result transfers.
What the failed four percent should teach
A single success flag compresses the most valuable part of the trial. The remaining four percent may contain several distinct systems problems:
Occlusion, glare, clutter or calibration caused a wrong pose or object estimate.
The selected grasp or path was infeasible, fragile or blocked.
The part slipped, collided, rotated or exceeded the gripper’s tolerance.
The part landed badly, but the workflow advanced—or a good placement was retried.
Latency, dropped frames, communication faults or stale state broke coordination.
The reset was quick, but invisible in a task-success percentage.
This taxonomy turns a headline into a post-training plan. Perception failures call for better viewpoints or more varied data. Contact failures call for demonstrations that preserve force, slip and recovery. Verification failures call for outcome labels and counterexamples. System failures call for timestamp and latency audits, not more model parameters.
DeepMind’s earlier Gemini Robotics report describes a careful real-robot evaluation procedure: multiple trials, models run back-to-back in random order to reduce environmental and operator bias, binary success plus a continuous progress score, and paired statistical testing. [3] Publishing a similarly detailed protocol for the factory pilot would make the 96% result far more reusable.
The capture specification behind a credible line claim
For an enterprise building or buying robot data, the evaluation schema should be designed before the trial. The unit is an episode, not a highlight clip.
initial_state · part_family · bin_fill · clutter · tray_layout
robot_state · hardware_version · gripper · calibration · model_version
outcome · success · progress · failure_stage · failure_mode
recovery · retry_count · autonomous_recovery · human_touch · reset_seconds
evidence · synchronized video · actions · state · safety events · reviewer
The logging rule matters as much as the columns: keep the failed takes. If a worker straightens the bin, clears a wedged part or tells the robot to resume, that event belongs in the episode. The intervention may be entirely reasonable. Hiding it prevents cost modelling.
Perit’s teleoperation programmes are structured around synchronized observations, robot state, actions and intervention logs. Its robot-video annotation adds task phases, success and failure labels, and review decisions. For broader pretraining, egocentric capture deliberately includes varied homes and workplaces, hesitation and failed takes, with a quality report for every batch.
That is the bridge between model research and procurement. A research team needs examples that improve the policy. An operations team needs evidence that estimates labour, interruptions and output. The same episode record can serve both if failure and recovery are preserved.
A production gate for the next 96% claim
Before moving from a promising proof of concept to a paid deployment, an enterprise can ask for seven artifacts.
| Artifact | What it prevents |
|---|---|
| Task contract | Success rules changing after results are seen |
| Exact denominator | Confusing grasps, placements, trays and shifts |
| Condition matrix | Averages hiding weak objects, poses or lighting |
| Failure taxonomy | Different remedies being grouped as “the 4%” |
| Intervention and reset log | Human work disappearing from autonomy claims |
| Good-output rate | Cycle speed being mistaken for production throughput |
| Held-out shift | Post-training and evaluation sharing the same narrow conditions |
A useful pilot can be small. It cannot be vague. Pre-register the task contract, vary a few important conditions, preserve every eligible attempt and report the rejected episodes separately. Then reproduce the evaluation after a model update, a gripper change and ordinary hardware wear.
The deployment gate should be stated in operational units: good trays per hour, mean time between human interventions, 95th-percentile recovery time, safety stops per shift and the cost of supervision. A target such as “96% task success” can remain in the report, but it should no longer carry the business case alone.
The right reading of Gemini Robotics 2.5
The Mercedes-Benz result should not be waved away because it occurred in an engineered cell. Industrial progress happens by making difficult tasks repeatable, then expanding the envelope. A humanoid using high-level embodied reasoning and a VLA action model to kit real automotive parts on active lines is a serious signal.
It is also not evidence that a 96% system can be copied into another plant, run unattended for a shift or meet a contractual throughput target. The public material does not yet provide that level of detail.
The most important number may therefore be the unreported four percent. Those episodes reveal whether the remaining work is better vision, more diverse demonstrations, tactile feedback, latency engineering, autonomous recovery or simply a technician standing nearby.
A model release makes the 96% possible. An evaluation record makes it usable.
Planning a factory-data pilot?
Start with the failure report before choosing the volume. Perit’s teleoperation samples show phase-level episode structure, and its sample library provides concrete deliverables for reviewing data and QC before a larger programme.
References and notes
- Google DeepMind, “Gemini Robotics 2.5 accelerates real-world general dexterity”, 10 November 2026. Source for the 200-task evaluation, reported 30%–100% success-rate improvements, 20%–30% faster completion, safety figures and the Mercedes-Benz proof of concept.
- Google DeepMind, Gemini Robotics 2.5 model page. VLA role, supported embodiments, whole-body control and 22-degree-of-freedom dexterity description.
- Google DeepMind, “Gemini Robotics: Bringing AI into the Physical World”, 2025, Appendix C.1. Source for the earlier family’s real-robot evaluation procedure; it is not presented as the unpublished protocol for the 2026 Mercedes-Benz pilot.
- Apptronik, Apollo 2 product page. Platform structure, operations layer, safety zones, modular mobility and battery claims. Product specifications are manufacturer-published.
- Google DeepMind, Gemini Robotics ER 2 model page. High-level reasoning, success tracking and hand-off to lower-level VLA control.
- Perit, Teleoperation, video annotation, and egocentric capture. Internal links describe Perit’s current capture, annotation and QC deliverables.